Summer hits the grid from two sides. Heat pushes demand up, and monsoon storms knock customers out. I measured both with public data and put them on one page: storm outages in dollars, the heat side in megawatts.
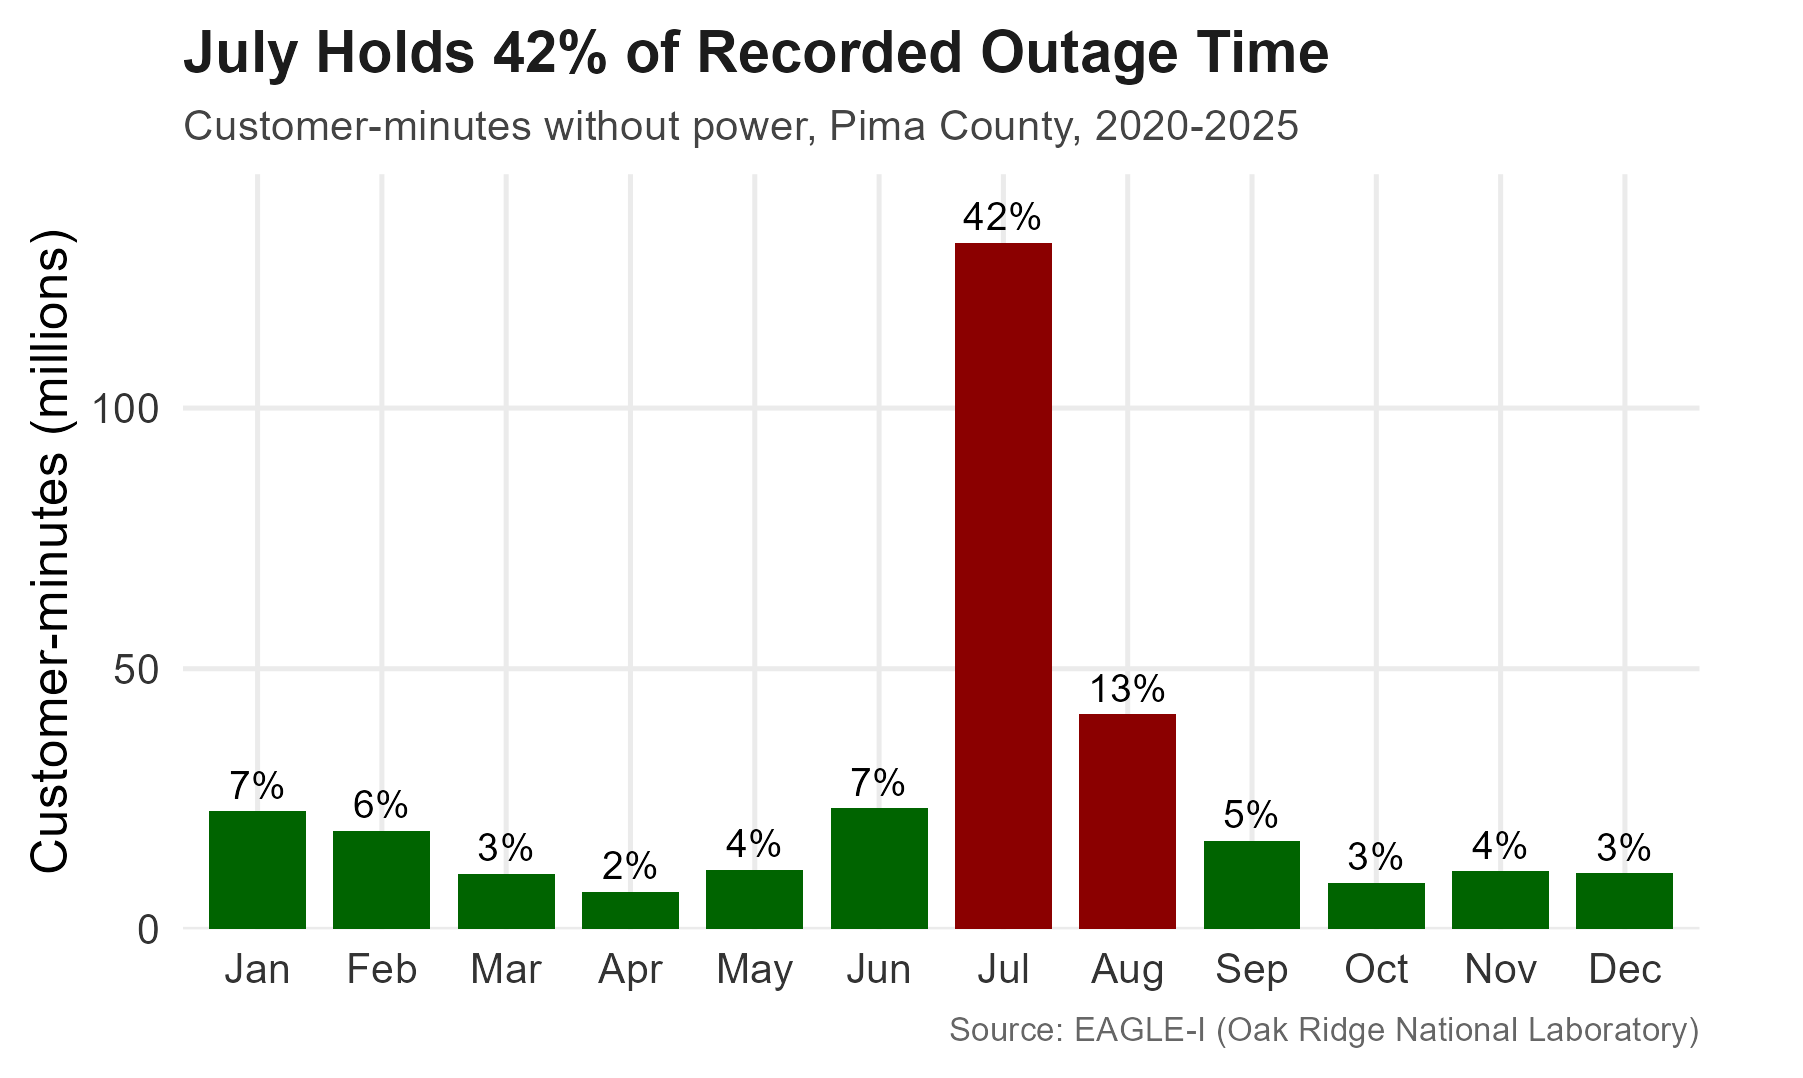
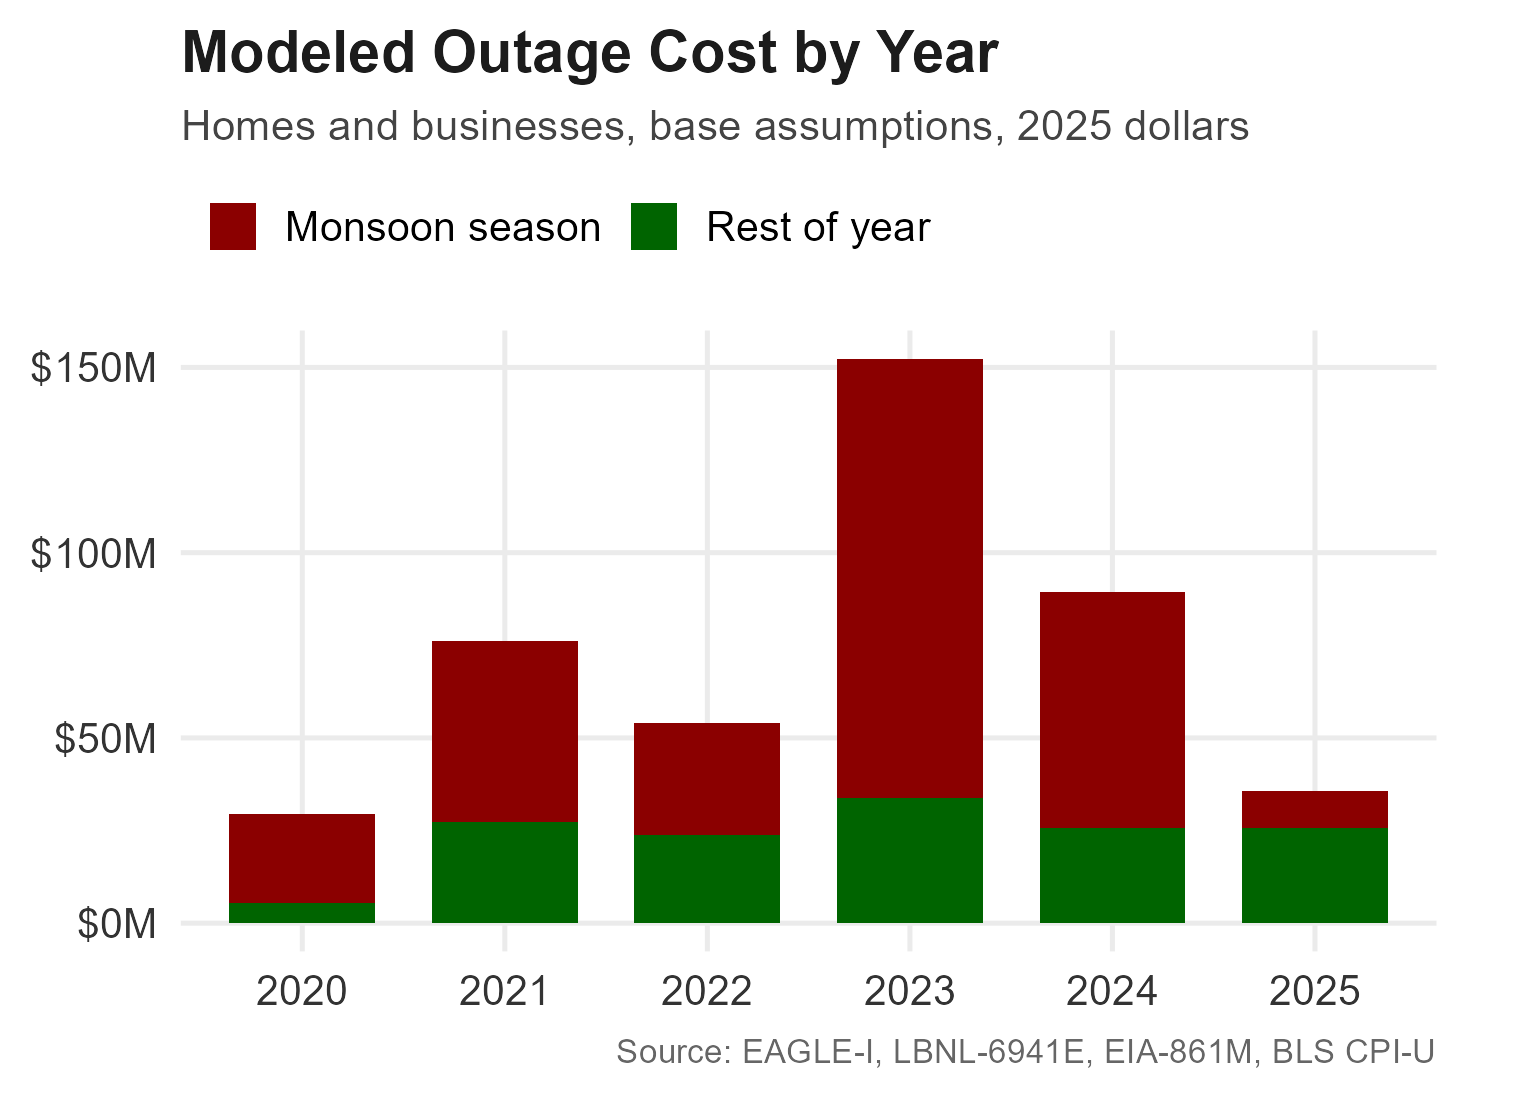
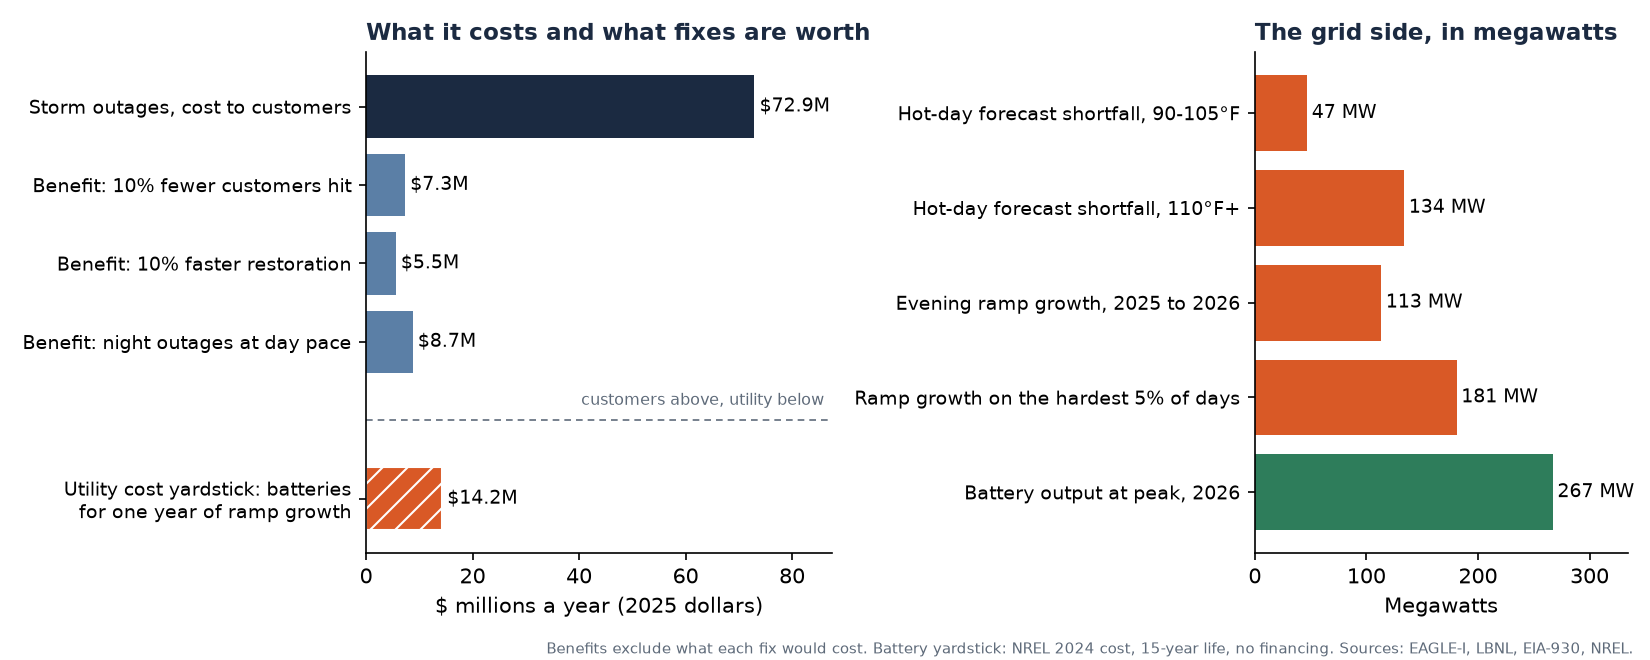
Power outages cost Pima County's homes and businesses an estimated $72.9 million a year from 2020 to 2025 (range $38 million to $143 million, depending mostly on how many of those affected are businesses). July alone holds 42% of all outage time.
The improvements are worth millions a year each. Interrupting 10% fewer customers per storm would be worth about $7.3 million a year to customers; restoring every outage 10% faster, about $5.5 million; restoring night outages as fast as daytime ones, up to $8.7 million. These are benefits only. What each improvement would cost to achieve is not public.
After accounting for weather, Tucson's demand grew just 1.7% from 2024 to 2026. But as solar farms produced 67% more in 2026 (January to early November, against the same months of 2025), the evening climb that other power sources must cover grew by 113 megawatts in a single year. Covering that one year of growth with batteries would cost on the order of $14 million a year.
The forecast is reliable except on hot afternoons. TEP's day-ahead demand forecast misses by 2.9% an hour on average, but on 90-105°F days it comes in about 47 megawatts short of the actual peak, and about 134 megawatts short on the rare 110°F days.
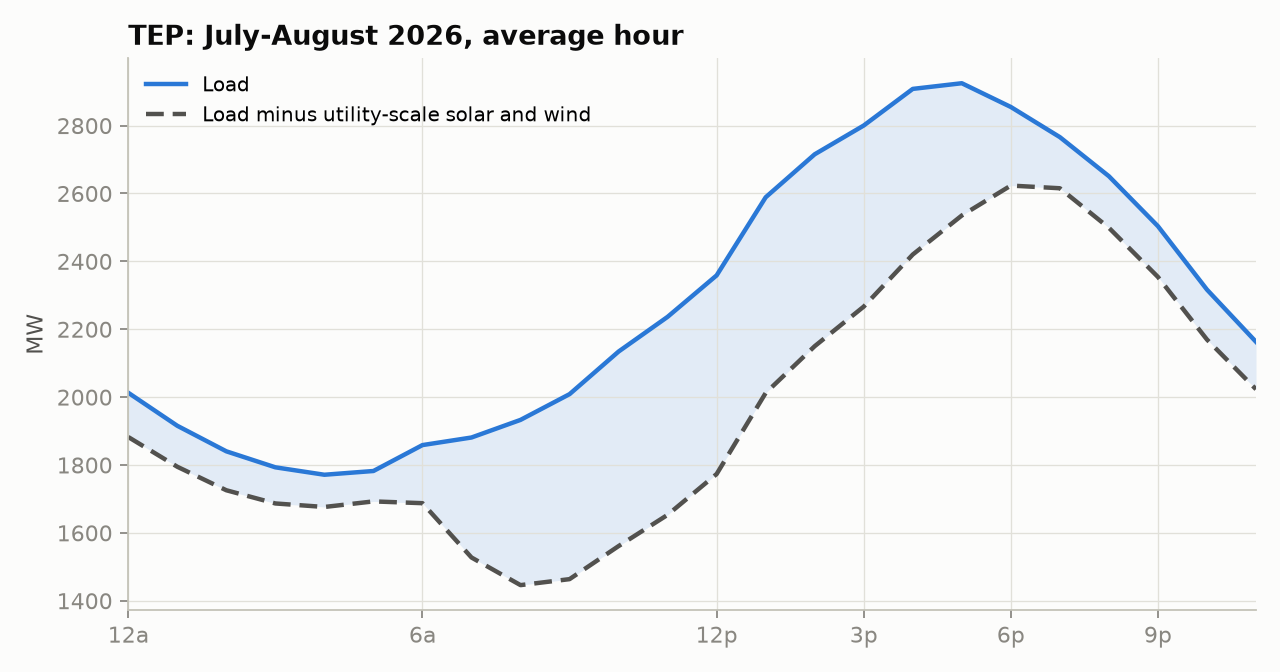
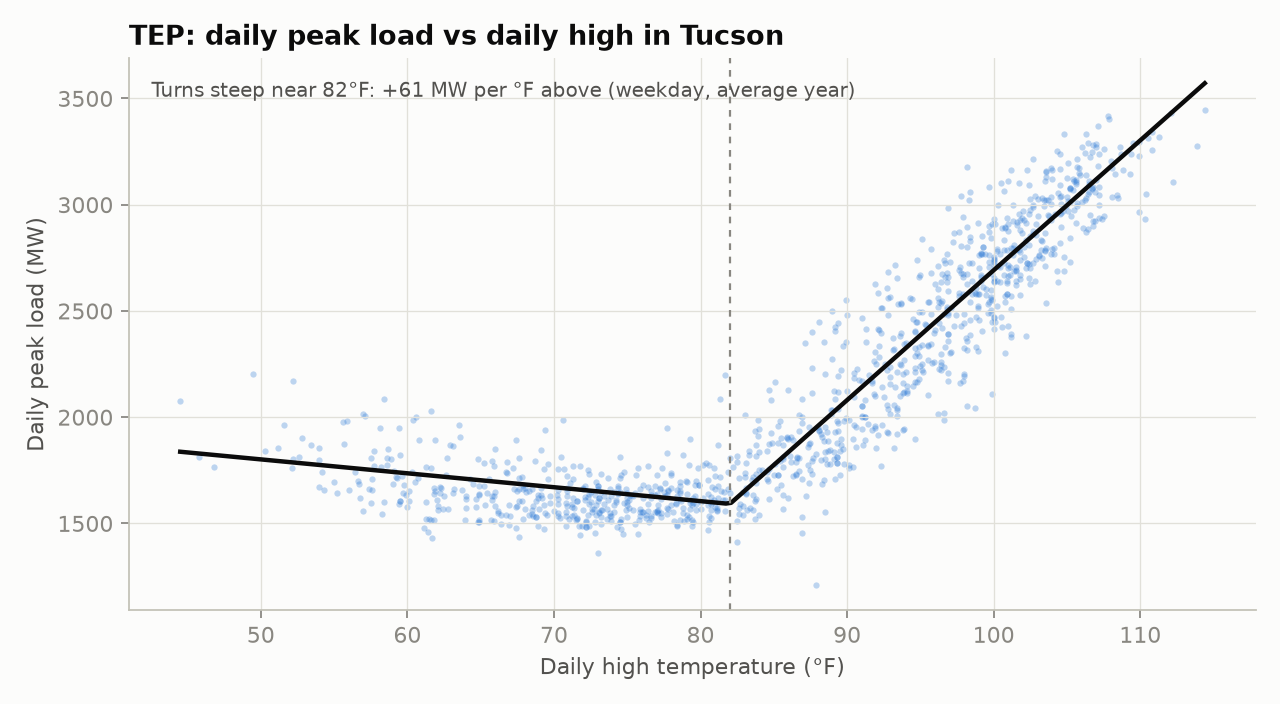
Electricity demand (the industry calls it load) follows the afternoon temperature. Below about 82°F, heat barely moves it. Above 82°F, air conditioning takes over. A megawatt measures power being used at one moment; on an average hot summer day TEP's peak, the day's highest hour, is 2,780 MW.
Each day the utility publishes a day-ahead forecast: its prediction of demand for every hour of the next day. Since August 2023 it has missed by 2.87% an hour on average (95% range 2.68-3.09%), which is accurate, and it doesn't lean high or low overall. The problem is concentrated in heat.
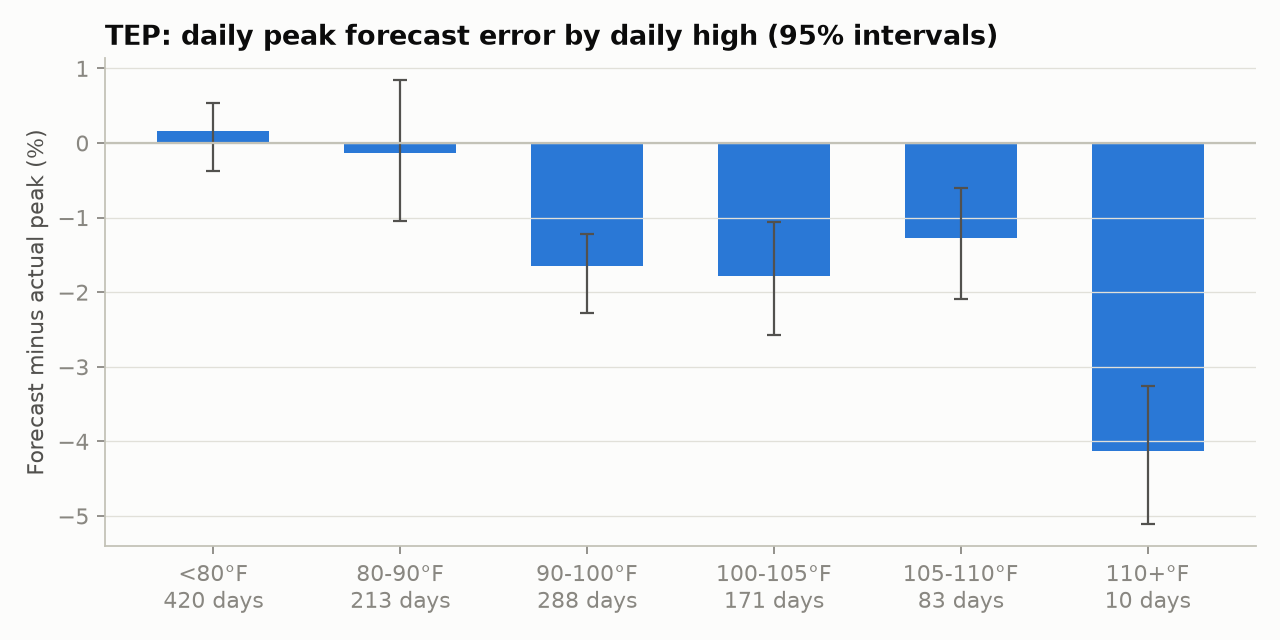
| Daily high | Days | Forecast minus actual peak | Days 3%+ too low |
|---|---|---|---|
| Under 80°F | 420 | +0.2% | 10% |
| 90-100°F | 288 | -1.7% | 35% |
| 100-105°F | 171 | -1.8% | 37% |
| 110°F+ | 10 | -4.1% | 60% |
On the 459 days between 90°F and 105°F, the forecast peak averages 1.7% low, about 47 MW. On the ten 110°F+ days, 4.1% low, about 134 MW at a 110°F peak. A wrong weather forecast explains little of it: hot days come in above forecast even when the temperature was called correctly.
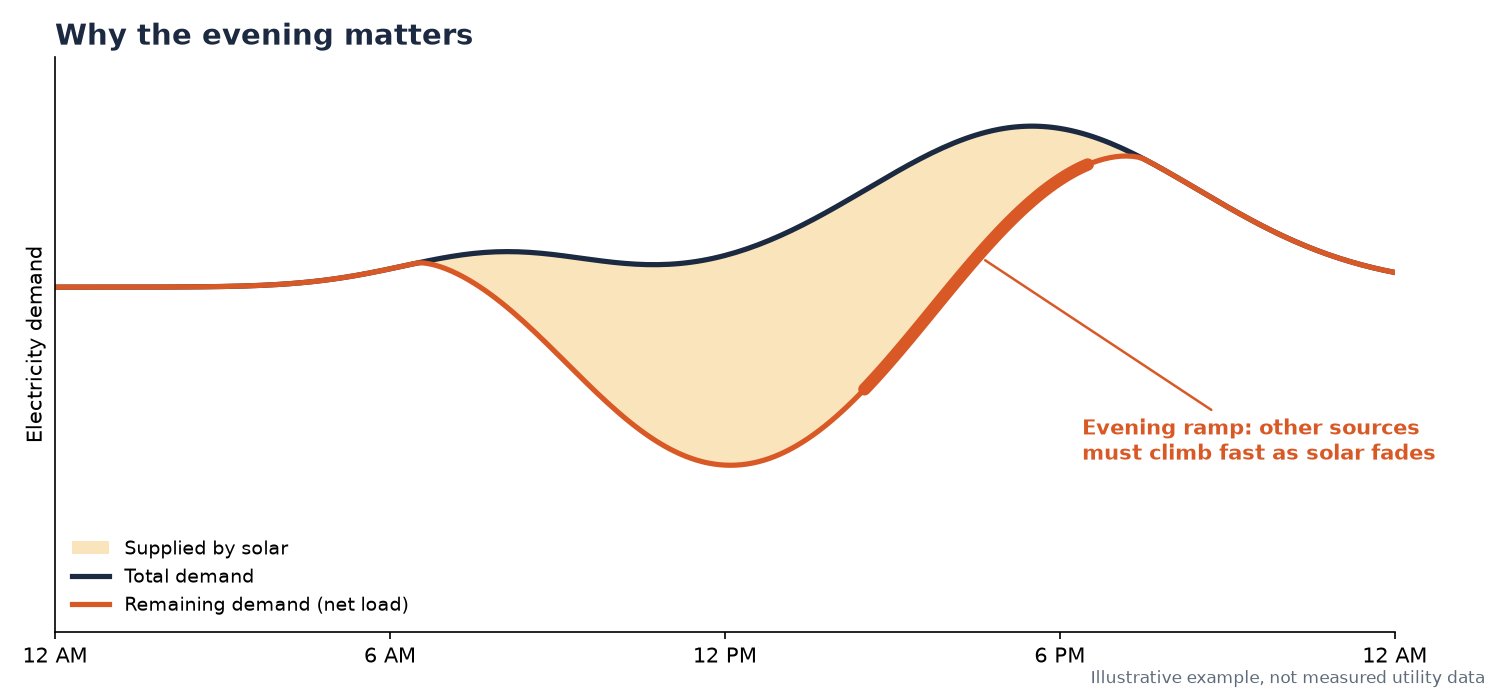
During the day, large solar farms supply part of the power people use. In the evening their output falls while homes and businesses still need power, so gas and coal plants, batteries and power from outside the area must pick up the difference fast. The demand left after solar and wind is called net load, and its climb at sunset is the evening ramp.
| TEP, large solar and the ramp | 2024 | 2025 | 2026 (to Nov 2) |
|---|---|---|---|
| Average output of large solar farms (MW) | 112 | 113 | 198 |
| Share of midday demand met by large solar farms | 19% | 20% | 31% |
| Average daily largest 3-hour rise in net load (MW) | 531 | 530 | 644 |
| The same rise on the hardest 5% of days (MW) | 687 | 687 | 868 |
| Average time of the net-load peak, summer | 5:08 PM | 5:29 PM | 6:10 PM |
After accounting for weather, average demand rose 1.7% from 2024 to 2026, and TEP's own sales grew 1.4% from 2022 to 2025. The net-load peak moved from about 5:30 to after 6 PM in one year, and the average evening climb grew 113 MW (181 MW on the hardest days). Battery output in the 100 highest-demand hours reached 267 MW in 2026.
Pima County's outage records come in 15-minute counts of customers without power. Measured in customer-minutes (one customer without power for one minute), July holds 42% of all outage time from 2020 to 2025, and June 15 to September 30 holds 66%.
Lawrence Berkeley National Laboratory publishes what an interruption costs a home, a small business and a large business, by outage length. Weighted by TEP's customer mix and moved to 2025 dollars:
A "big outage night" is one with 5,000 or more customers out at once.
Storm outages have a price: what interruptions cost customers. The grid side is measured in megawatts. To put them on the same page, this section shows both, and adds a battery yardstick to the megawatts.
| Summer problem | What it costs or how big it is | One fix and what it's worth or costs (2025 dollars, per year) |
|---|---|---|
| Storm outages | $72.9M a year to customers (range $38M-$143M) | 10% fewer customers hit: $7.3M benefit. 10% faster restoration: $5.5M. Night outages at day pace: $8.7M ($4.7M if only half the gap closes). Fix cost not public |
| Evening ramp | +113 MW in one year (+181 MW on the hardest days) | Batteries sized to one year's growth: about $14.2M a year ($22.7M for the hardest days); $155M up front |
| Hot-day forecast | 47 MW short on 90-105°F days; 134 MW on 110°F+ days | A forecasting fix, not a build. No public price |
At $72.9 million a year to customers, the improvements priced here are worth $5.5 million to $8.7 million a year each, before counting what they cost to achieve.
One year of solar growth added a ramp that would take about $14 million a year in batteries to cover. Demand is barely growing; the hour when other power is needed is moving from about 5:30 to after 6 PM.
A peak forecast that runs 47 MW short on most hot days, and 134 MW on the hottest, is fixed in the model, not by building anything.
July holds 42% of outage time and storms build from mid-afternoon, while the net-load peak now comes after 6 PM.
What public data can't answer: what each improvement would cost TEP to achieve, how TEP's own load model treats heat and rooftop solar, and how its planned batteries cover the 6 PM peak.
Eight pages for a business reader: the four acts, every table above, and how the numbers were made.
Download the memo (PDF)TEP, APS and SRP, plus an Arizona comparison: heat response, weather-adjusted growth, forecast accuracy and the evening ramp.
Download the peak memos (PDF)The full storm study with all four models: outage severity, restoration time, big-night warning and a decision-tree rule card.
Download the outage paper (PDF)The demand study is Python with DuckDB SQL on hourly grid data; the storm study is R on 15-minute outage counts. One script joins both into a single results file, and a checker confirms every number in the memo, deck and this page traces to it.
python pull.py re-pulls both halvespython peak/analysis.py runs the demand studyoutages/build_paper.ps1, then Rscript deck/deck_charts.R from outages/, builds the outage paper and its chartspython combine.py writes one results file and the Act 4 chartpython check_numbers.py confirms every numberpython build_memo.py renders the memopython deck/build_grid_deck.py and --mini build the decks